📊【XWIN TREND INDEX|July 12, 2026】
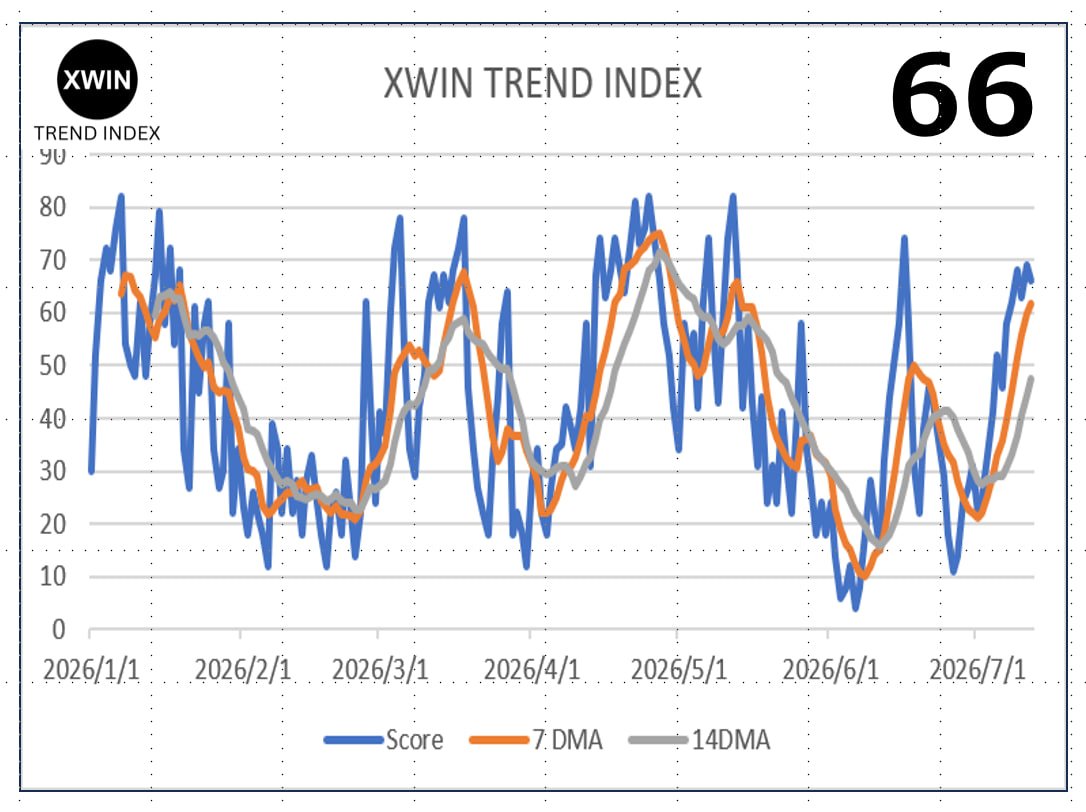
Overall score: 66 / 100
・80–100 = Strong uptrend
・60–79 = Slightly up
・40–59 = Neutral / No clear direction
・20–39 = Slightly down
・0–19 = Strong downtrend
7‑day average moving line: 61.71 ↑
14‑day average moving line: 47.36 ↑
The directional bias is “slightly up”.
Supply structure and regulatory aspects are improving, but spot demand remains weak, so a solid upward move has not yet been confirmed.
―――――――――――――――――――
Market Summary
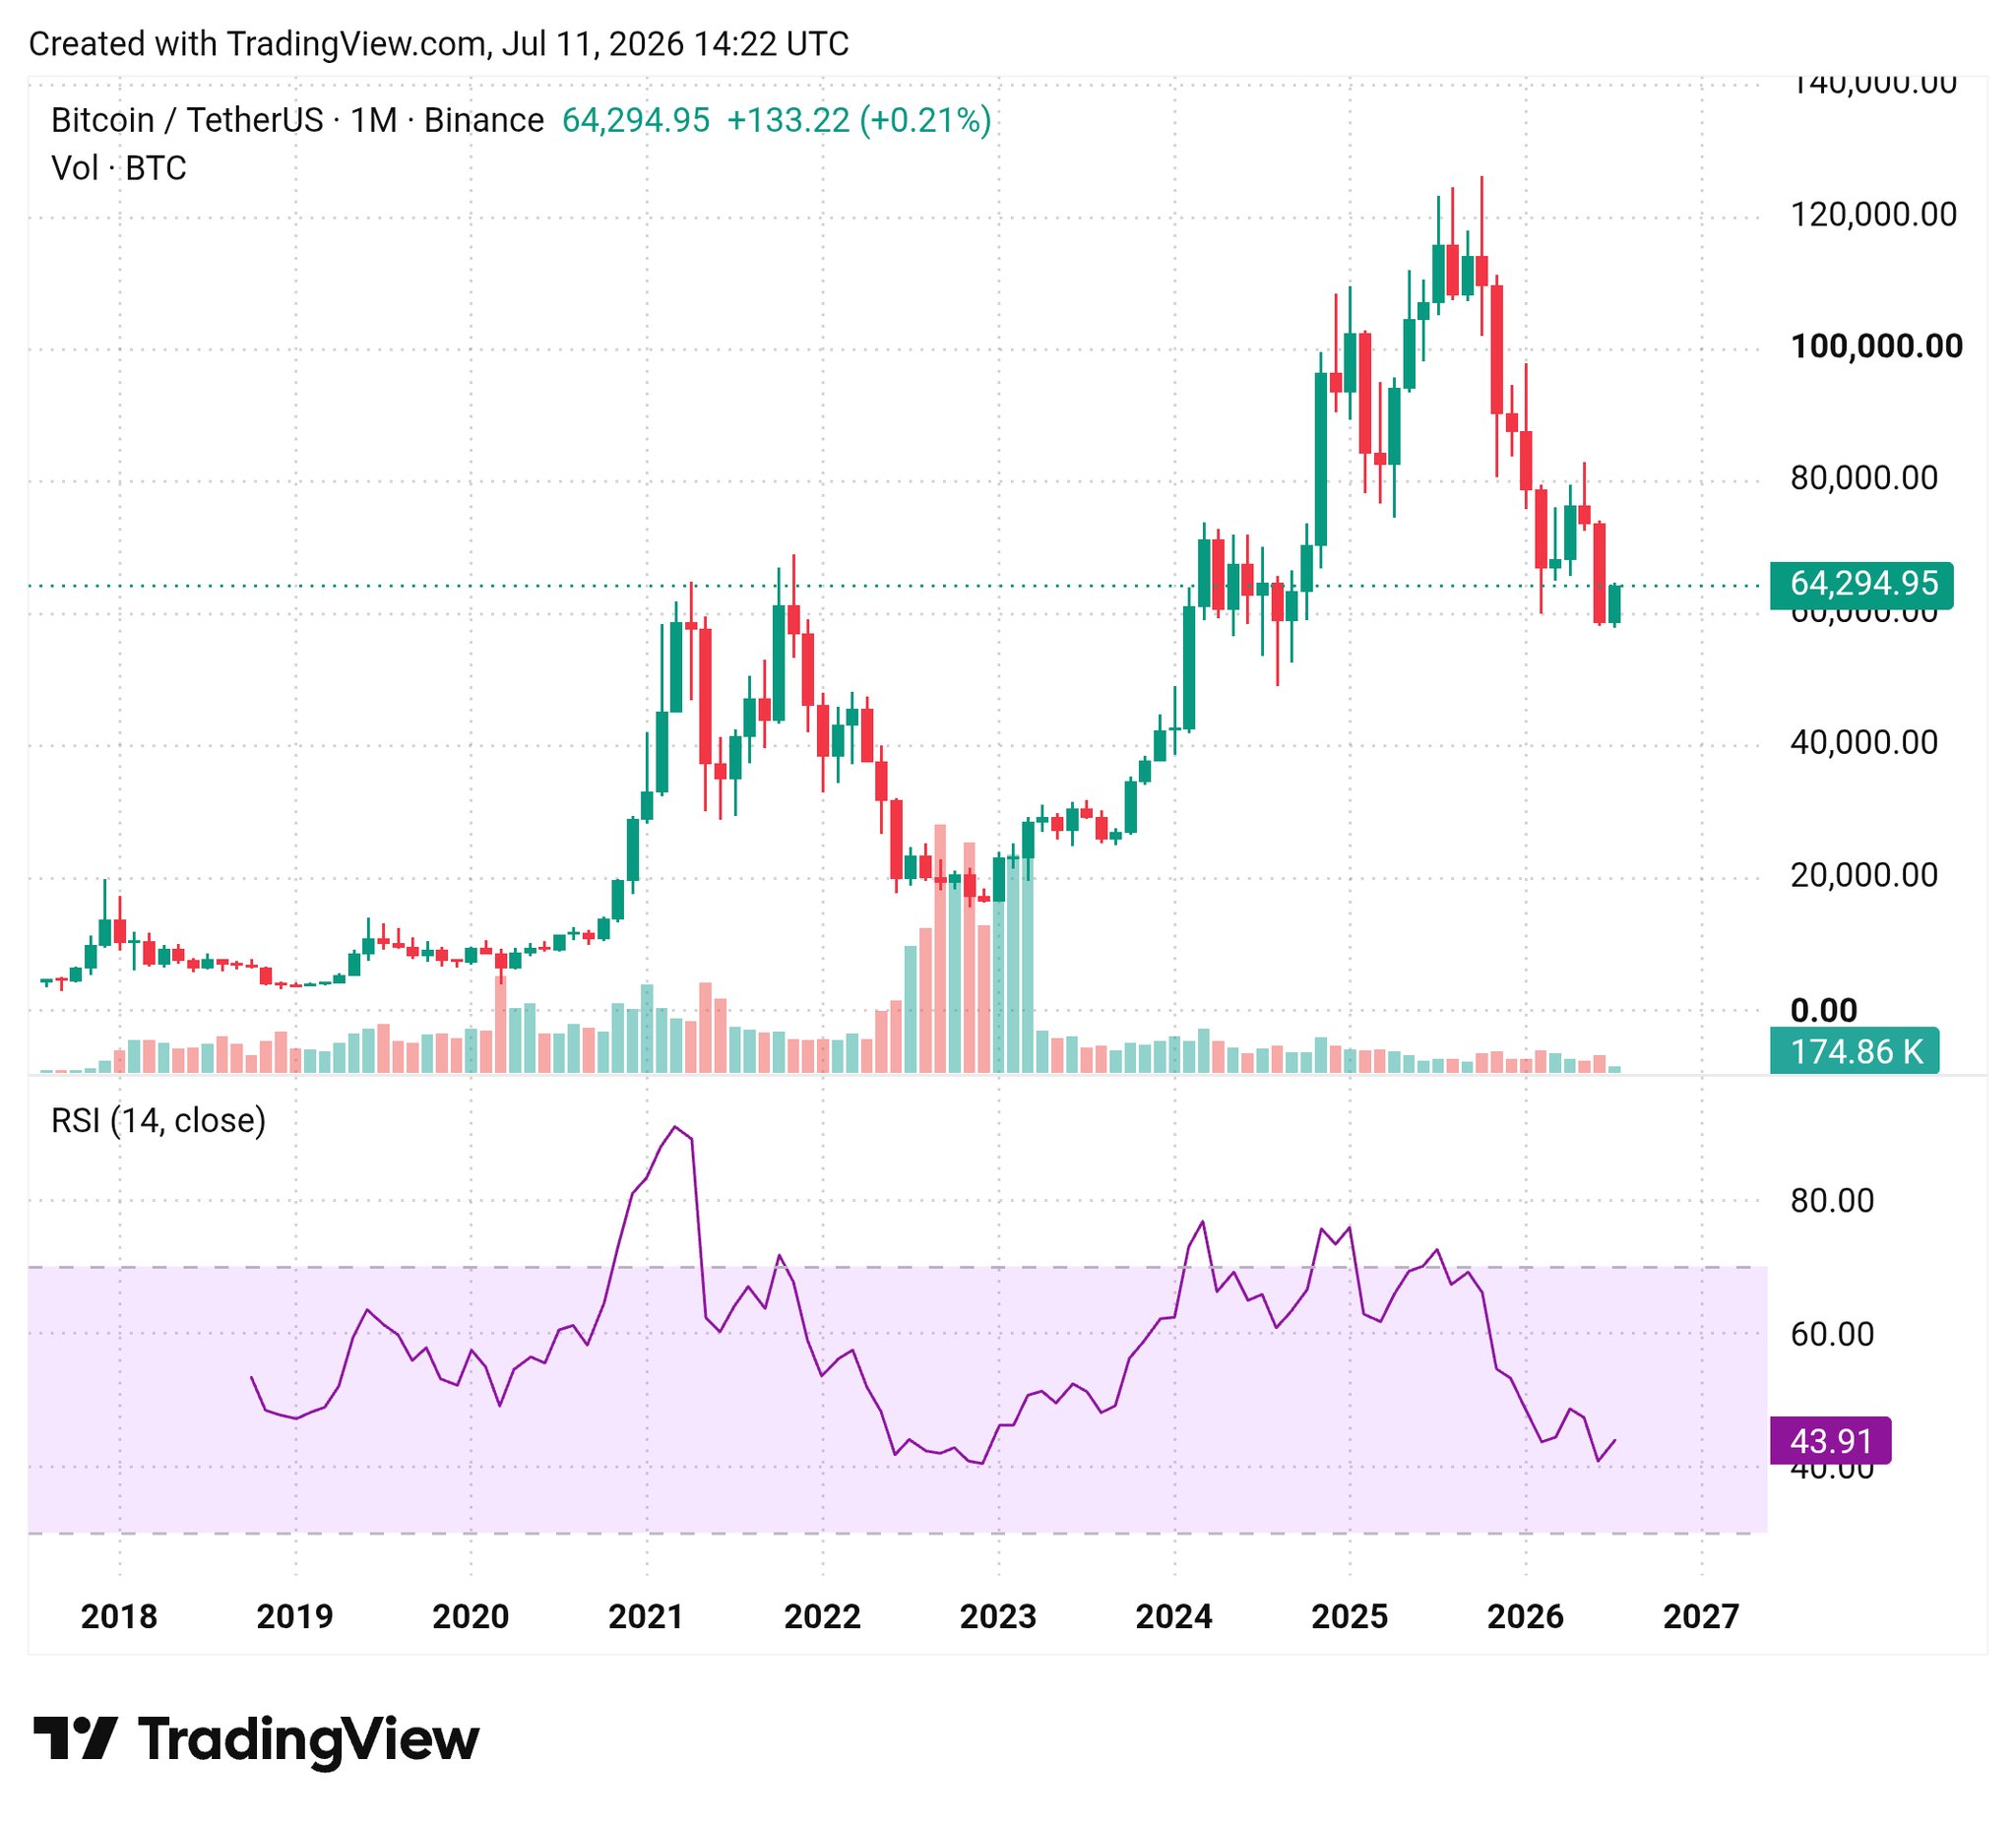
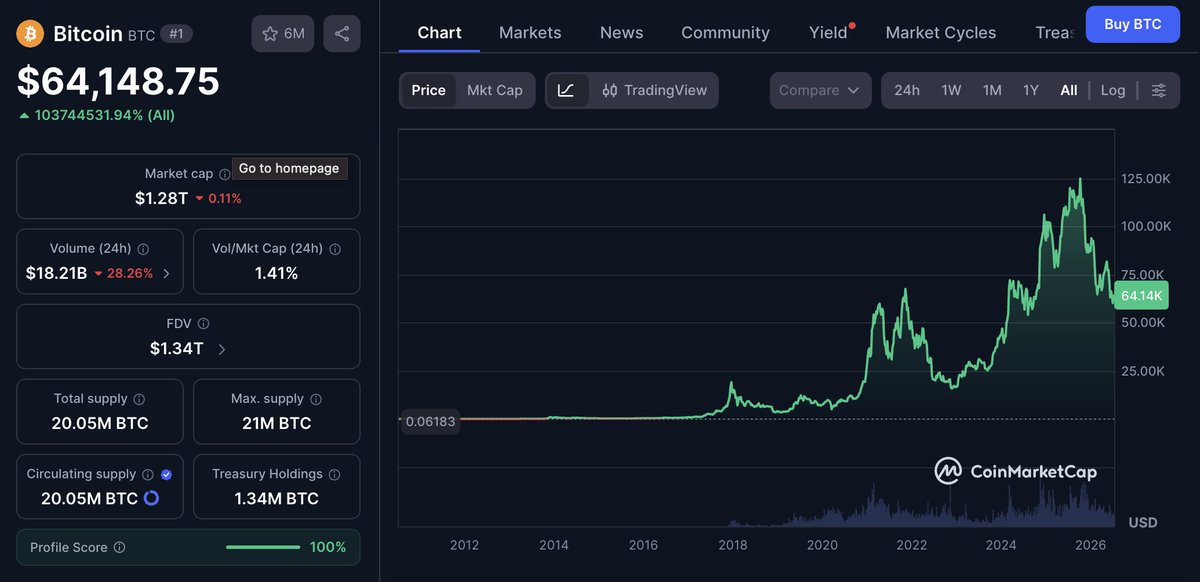
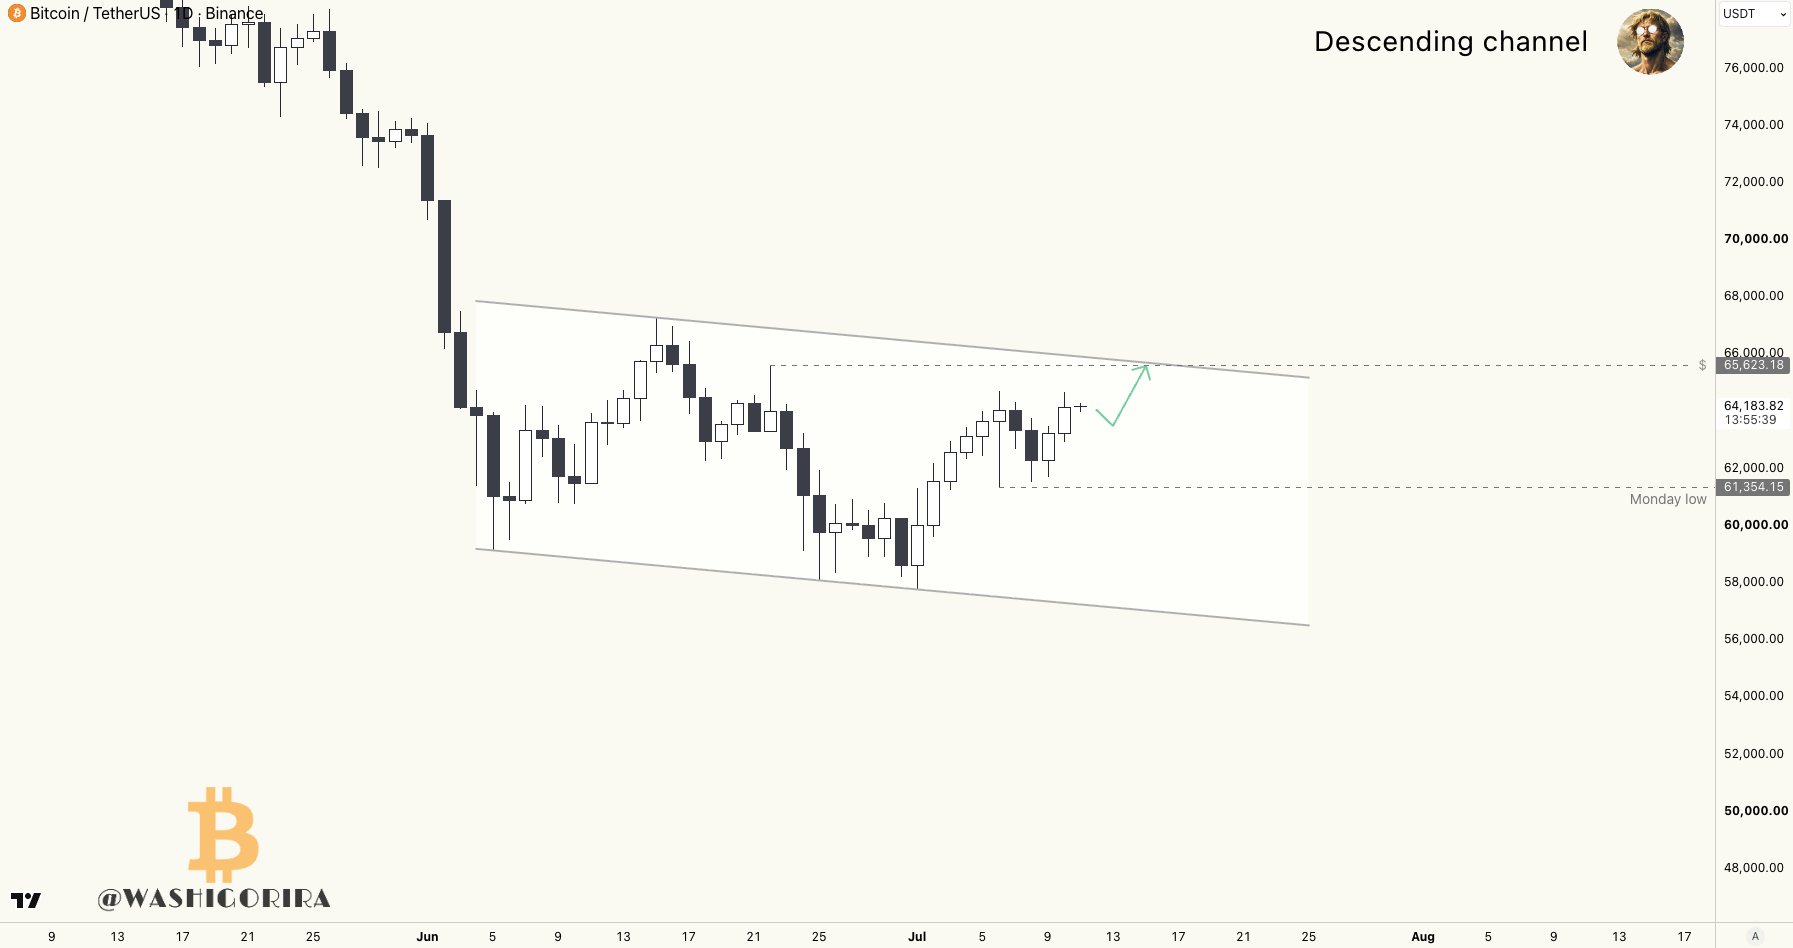
・BTC is holding firm around $64,000, while ETF flows are volatile day‑to‑day and full recovery of institutional demand has not been observed.
・After roughly two months of net ETF outflows, weekly data shows signs of inflows, suggesting possible mid‑term supply‑demand improvement.
・Several analyses describe the current BTC market as being “in the transition from the late bear phase to an accumulation stage.”
・Long‑term holders maintain high balances, and short‑term sellable supply is on a declining trend.
・ETH/BTC is showing signs of improvement, indicating that capital may start rotating from BTC into ETH and large‑cap altcoins.
・Interest in tokenised stocks (e.g., Robinhood) and projects like Aave demonstrates continued inflows into RWA and DeFi sectors.
・In the US, expectations around the CLARITY bill persist, making regulatory clarity a medium‑term market theme.
・The expansion of global M2 provides medium‑term liquidity support, though its impact on BTC price may be lagged.
―――――――――――――――――――
On‑chain & Technical Trend
・The 7‑day net flow on exchanges remains in net outflow, so the amount of sellable BTC being brought onto exchanges is not increasing.
・Funding Rate is decreasing and Open Interest is slightly being cleaned up, cooling down long‑side overheating compared with the previous day.
・Supply from long‑term holders stays at a high level, indicating a strong structural supply outlook in the medium‑to‑long term.
・The Composite Index shows a partial reset but has not fallen to the pessimistic lows seen in 2015, 2018 or 2022 bottoms.
・IBCI hovers around 4.76, suggesting an accumulation zone rather than an overheated market.
・BTC is starting to break above its daily downtrend, but whether it can clearly break the $64,000‑$68,600 range is the next key test.
・Spot demand remains weak; CryptoQuant is cautious about the sustainability of any price recovery.
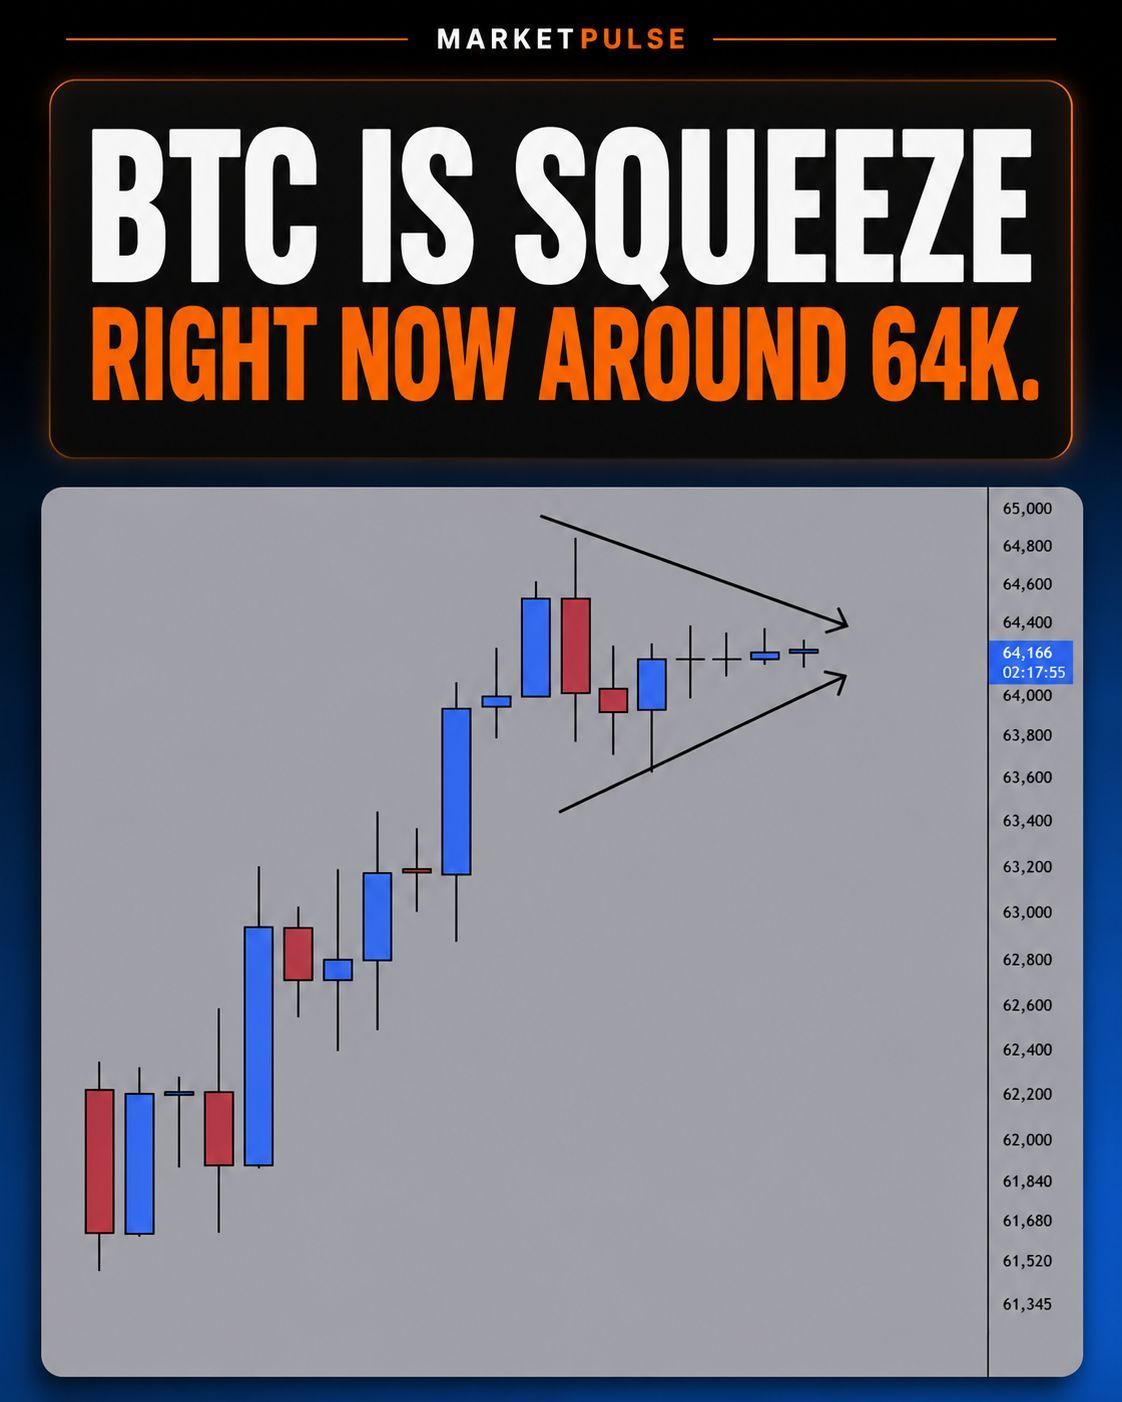
・In the short term, watch for price moves targeting upward liquidity around $65,000 and downward liquidity below $61,500.
―――――――――――――――――――
Sentiment
・Investor mood has improved from the extreme pessimism of late June, but it has not turned fully bullish yet.
・Continuing BTC holdings by long‑term investors and corporations support supply and medium‑term sentiment.
・A positive swing in ETF flow is a favorable sign for institutional sentiment, but its persistence needs confirmation.
・Retail selling continues, while whale sell‑offs are limited, possibly indicating a turnover in holding parties.
・The decline in Funding Rate and OI signals that excessive optimism has cooled.
・The rise in ETH/BTC fuels expectations of capital rotating into altcoins, but the rally is still short‑lived, not confirming a full‑blown alt‑season yet.
・Trading volume remains sluggish in markets such as Korea, with retail demand weak in certain regions.
・Current sentiment is assessed as “a transition from pessimism to cautious optimism.”
―――――――――――――――――――
US Traditional Market
・US equities, especially AI and semiconductor‑related stocks, remain resilient, and the overall risk‑asset environment is improving.
・Nonetheless, within the Fed there remains vigilance on inflation, leaving the timing of rate cuts uncertain.
・Oil prices have settled down from post‑war highs, easing some inflation concerns.
・High equity‑ownership ratios and low cash balances in US households indicate strong risk appetite but also make them vulnerable during corrections.
・Global M2 expansion could act as a medium‑term boost for equities and crypto assets.
・AI investment supports growth, yet rising capex could feed inflation and keep interest rates elevated.
・Tokenisation efforts by banks and broker‑dealers, stablecoin deployment, and AI‑driven fund experiments are blurring the line between TradFi and crypto.
・Going forward, deliberations on the CLARITY bill, inflation data, and Fed officials’ remarks will influence both BTC and US equity directions.
―――――――――――――――――――
Overall Assessment
The market is moving from the late stage of a bear market into an accumulation phase. Increases in long‑term holder balances, BTC outflows from exchanges, leverage unwindings, and improving ETF flows are all positive supply‑side and structural shifts.
However, the biggest challenge remains spot demand. Even if prices rise, without sustained ETF inflows and spot volume, the rally may end as a short‑term bounce.
Key points to watch today include whether ETF flows stay positive, Open Interest recovers without overheating, ETH/BTC continues its rise, and BTC breaks through the $64,000‑$68,600 resistance zone.
 Bitcoin (BTC)
 Titan of Crypto TA_Analyst Trader B139.44K @Washigorira
 214 25 14.52K 閱讀原文 >釋出後BTC走勢看漲
 Ordinal News 🟠 Media Educator B28.29K @Ordinal_News
 J.Dog ᛤ D12.80K @Relentless_btc
 97 5 1.05K 閱讀原文 >釋出後BTC走勢看漲
 AA ⚡️ Influencer Educator S14.86K @AAStack
 25 5 432 閱讀原文 >釋出後BTC走勢極度看漲
 Joe Burnett, MSBA FA_Analyst Influencer B105.98K @IIICapital
 Li₿an_₿itcoin⚡️ Educator Influencer D7.81K @Liban_Bitcoin
 Muslim Bitcoiner BIP-110⚡ D12.35K @MBitcoiner0 0 208 閱讀原文 >釋出後BTC走勢看漲